lastmod: 11 May, 2020
Greetings, R and RStudio!
What is R

Fig. 1: R logo
R, hosted by The R Project for Statistical Computing is the software that we’ll be using to do our data processing and analyses. I specifically refrain here to say “statistical analyses” because, as you’ll see, many computations have little and even nothing to do with the ‘classical’ statistical analyses. While, at some point in the future, the distinction will have become blurred enough, for now, we leave it be, with the important caveat that ‘statistical representativeness’ is contingent on the extent the data that we use is representative.
Coming back to the R software, it is a programming language that allows the user to manipulate, modify, and analyse data in various forms. It presents the user with a rather limited interface, and relies almost entirely on user commands or inputs written by hand in a command line interface (see below).
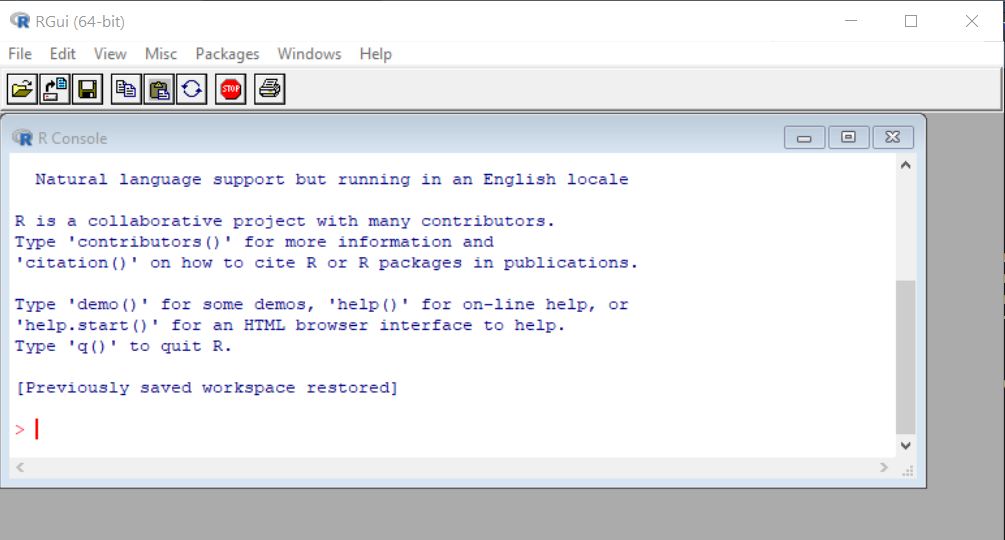
Fig. 2: R start screen
However, the most important question is ‘what is R, for us’? As in, ‘why do we use R and not something else’? The answer is, mainly, because R is The Statistical programming language. There are other programming languages (notably Python, for instance) and software, but nothing surpasses, as of yet, R’s capabilities, overall. It simply checks the most boxes. It is open source, it is free, as in without cost, it allows, or better said, promotes and even enforces reproducibility and transparency in research, with a direct relevance for accountability. Last but not least, almost all that can be done in any other software or programming language, can be done in R, too.
Actually, short of cooking dinner for you, there is little that R, especially extended through R Studio cannot do. For instance, this tutorial is written in R Studio and the entire web site is built in R Studio, via a few magic tricks.
Nevertheless, R is not always liked. Many people are not accustomed with working in command line and have little or no background in programming. This makes their experience with R awkward and even frightening at times. They might even be very versed in statistics, but that doesn’t help much. It is understandable and it happens to many people. Even those who adopted R as their main tool of choice for data science and/or statistics make compromises about its use full-time.
Never fear! R Studio comes to the rescue. Scripting (coding) in many programming languages was eased by the development and use of the so-called integrated development environments, or IDEs, for short. For the laymen, these are specifically developed software that act more or less as interfaces between the user and the program itself (much more than interfaces, in all honesty). Their main purpose is to ease the writing and the structuring of the code, while providing many other helpful capabilities (management of projects, debugging, testing, etc.) and most of them do a tremendous job in this regard.
What is RStudio IDE

Fig. 3: The R Studio logo
As mentioned above, already, RStudio is The IDE for R. Again, there are others, but for our purposes, RStudio is the choice.
At first sight, RStudio is not much friendlier than R… but, fortunately, that doesn’t last long. It’s a matter of acquired taste, but it’s easy to get accustomed to it, if you just allow yourself a few minutes to know it.
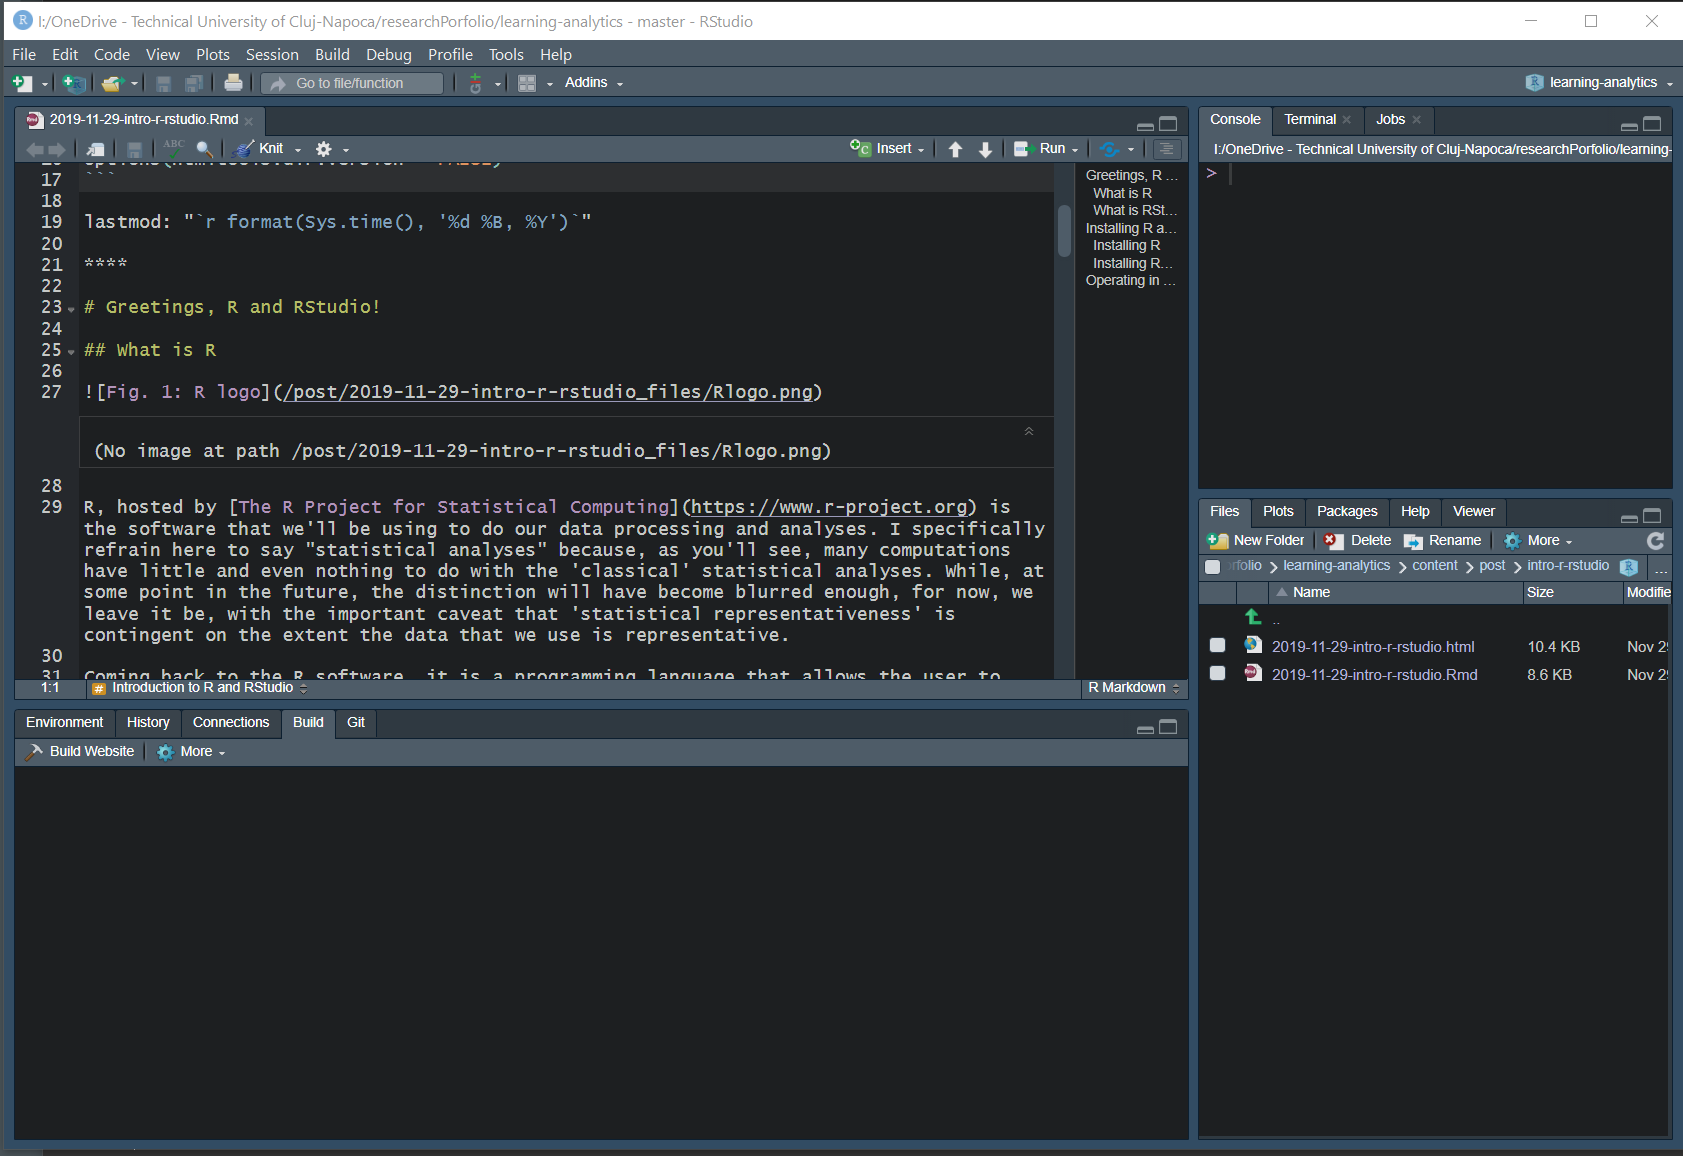
Fig. 4: The RStudio work screen
RStudio has four main (resizable) windows, each accommodating various functionalities of the program. For instance, in the image above, the main script is shown in the upper-left quadrant/window. However, the user can, if they choose so, write commands in the ‘console’, i.e., the upper-right window. The lower-left window presents the output of running the script. Finally, the lower-right window presents the current directory (mind you, not the working directory, which is a completely different matter).
Two things are important at this time. First, this layout is personalized for my use, and, eventually, each user personalizes the way RStudio looks to accommodate their own preferences. Second, which may already be noticed by the keen observer, each of these four windows is tabbed, meaning that they can present different views corresponding to different functionalities. But more on that, latter, as we begin using RStudio.
Installing R and RStudio
While I am trying to keep this tutorial and the ones connected as basic as possible, and provide all the information needed for someone with little or no experience with R and RStudio, a minimal knowledge of how to operate the computer, like installing programs under your operating system of choice, is assumed.
Please, remember, you’ll need to install both R and RStudio (if you haven’t done so, already), and if you’re doing this for the first time, I suggest you do so in this order (first install R, and then, install RStudio). Also, I recommend to install the 32 or the 64-bit version, corresponding to your operating system.
It would also be a good idea (unless you really know what you’re doing) to install the programs with their defaults (default settings, locations, etc.).
This is how to check if your system is a 32 or a 64-bit operating system for Windows, and, respectively, for Mac
Installing R
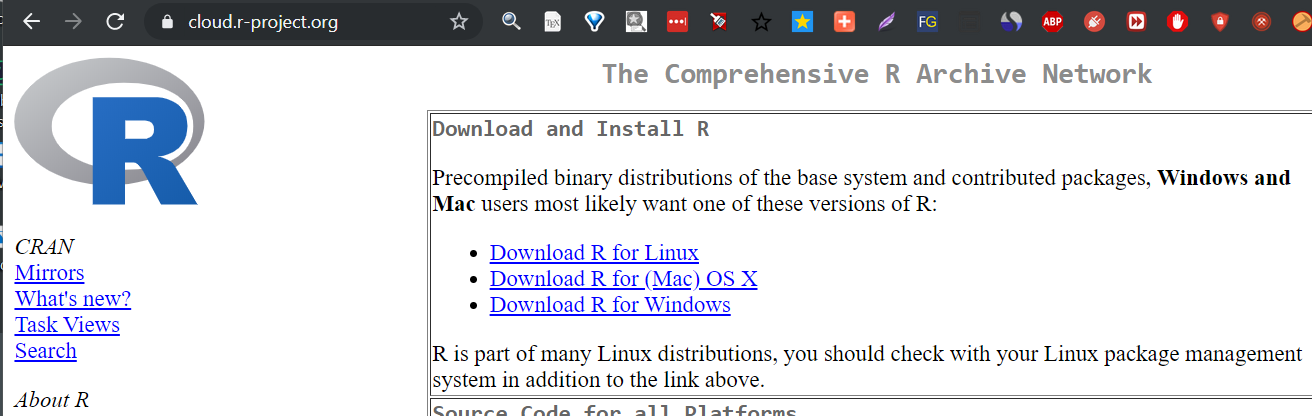
To install R, you need to first download it from The R Project for statistical computing. Here, you’ll be directed to a list of ‘CRAN mirrors’ (i.e., a list of servers), from where you can select one and download R. I suggest you choose 0-Cloud, unless you have a specific reason to choose another. Finally, after selecting your mirror, you’ll land on webpage with direct links to the latest stable version or R for Windows, Mac OS, and Linux. This few instructions should get you going (as I said, I’m assuming some knowledge of installing software on your computers), and the images below should confirm for you if you reached the right places or not.
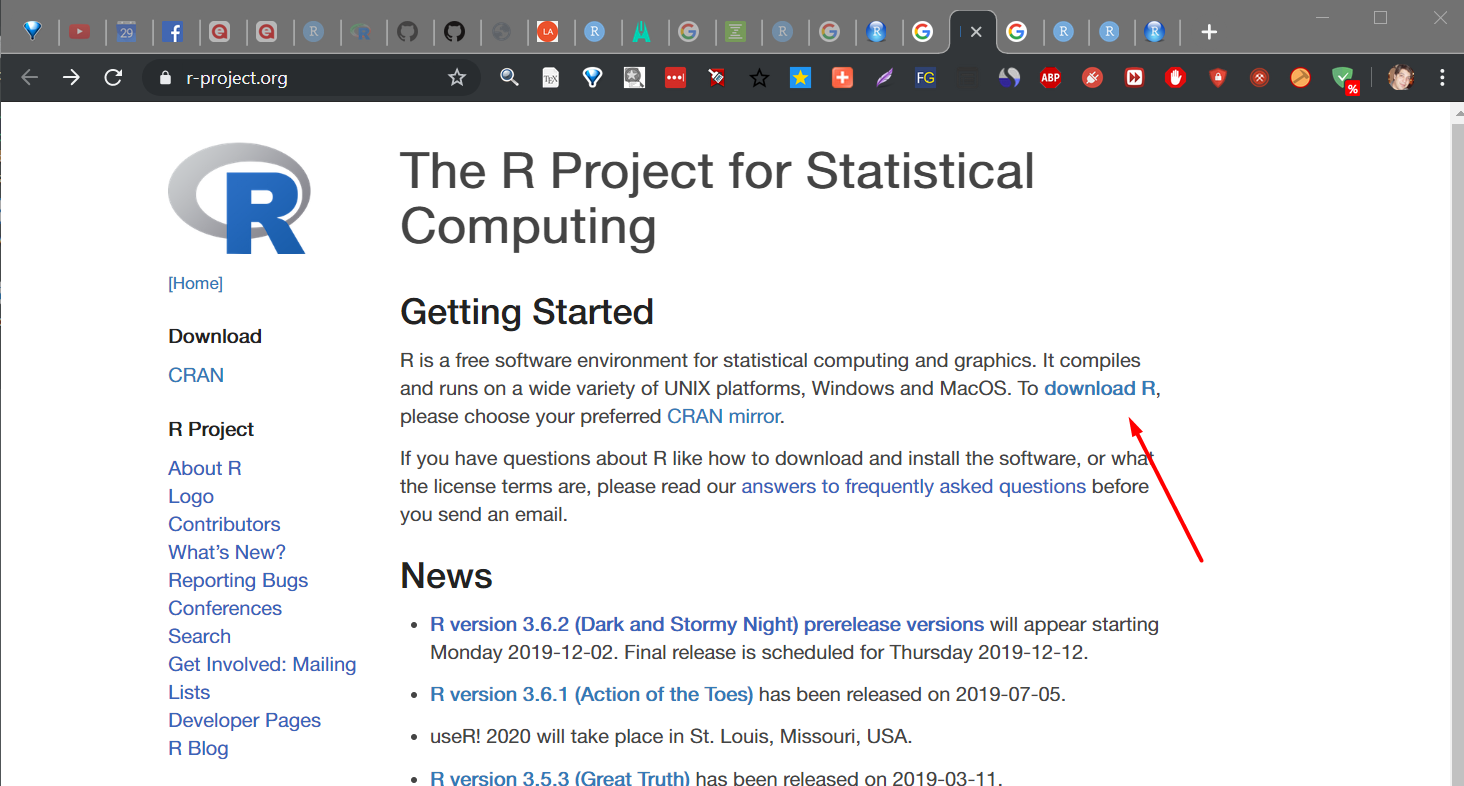
Fig. 5: R Project for statistical computing homepage
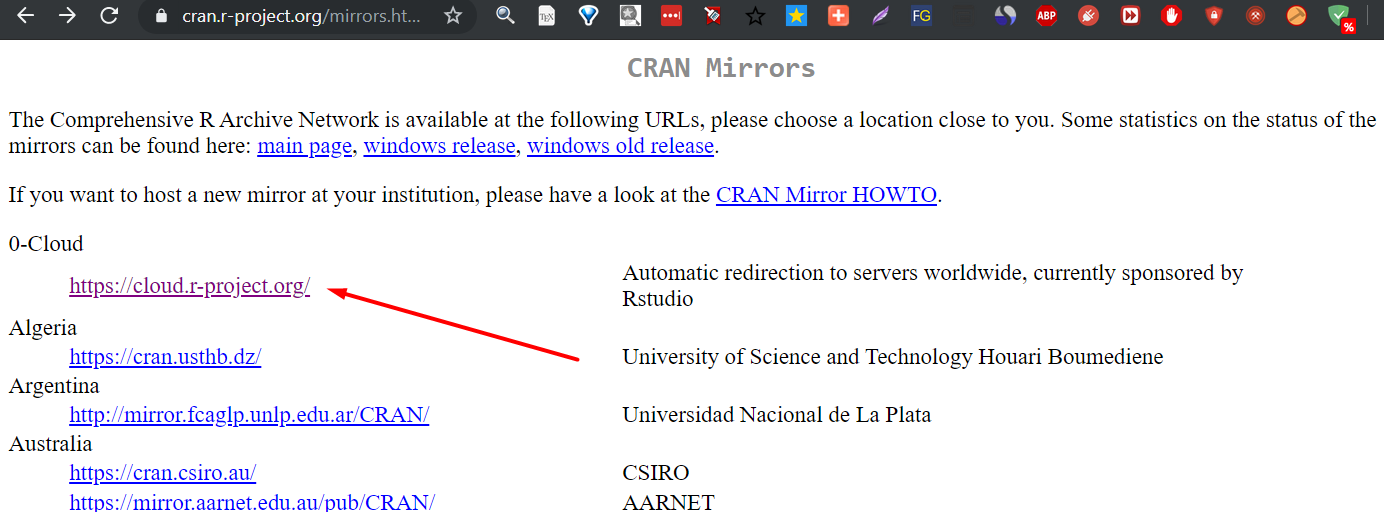
Fig. 6: List of CRAN mirrors
 ){ height=220px}
Installing RStudio
Installing RStudio is just as straightforward, or not… First, you need to download it from https://rstudio.com/. More precisely, once at RStudio’s homepage, click on Products and select RStudio. You’ll be presented with two versions, RStudio Desktop and RStudio Server. You’re interested in the first, i.e., RStudio Desktop. Or, you can just skip all the above, and go directly to the RStudio Download Page and choose the free version of RStudio.
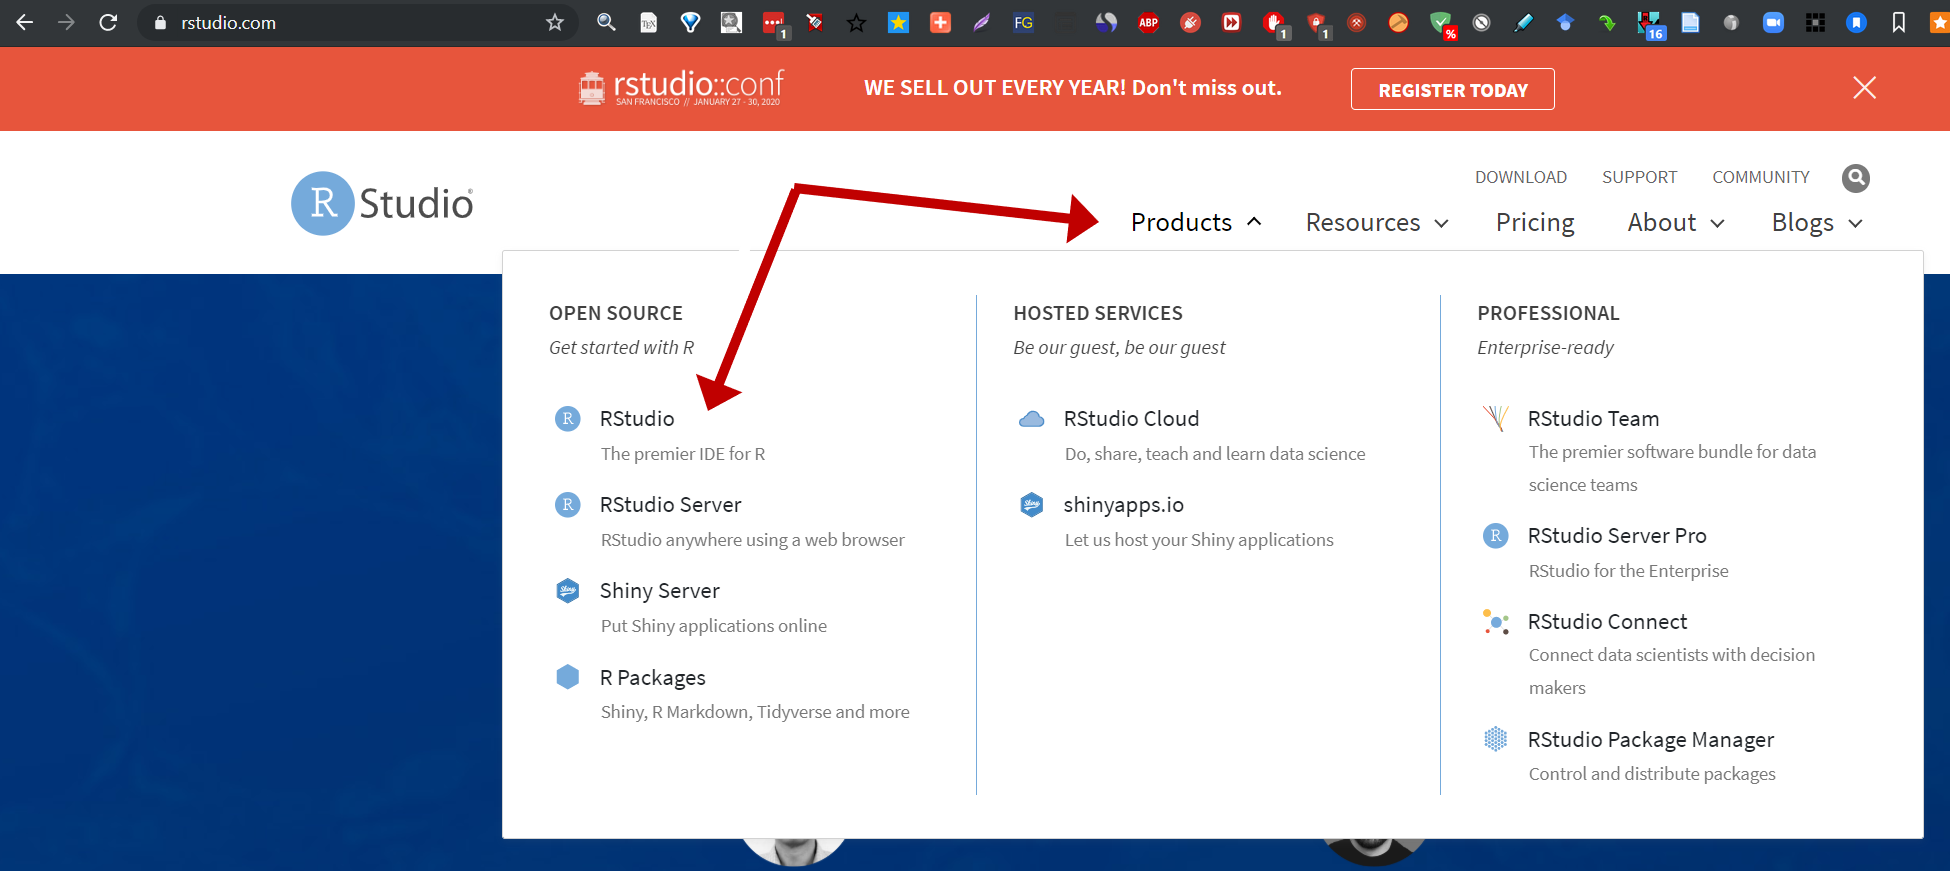
Fig. 8: RStudio homepage
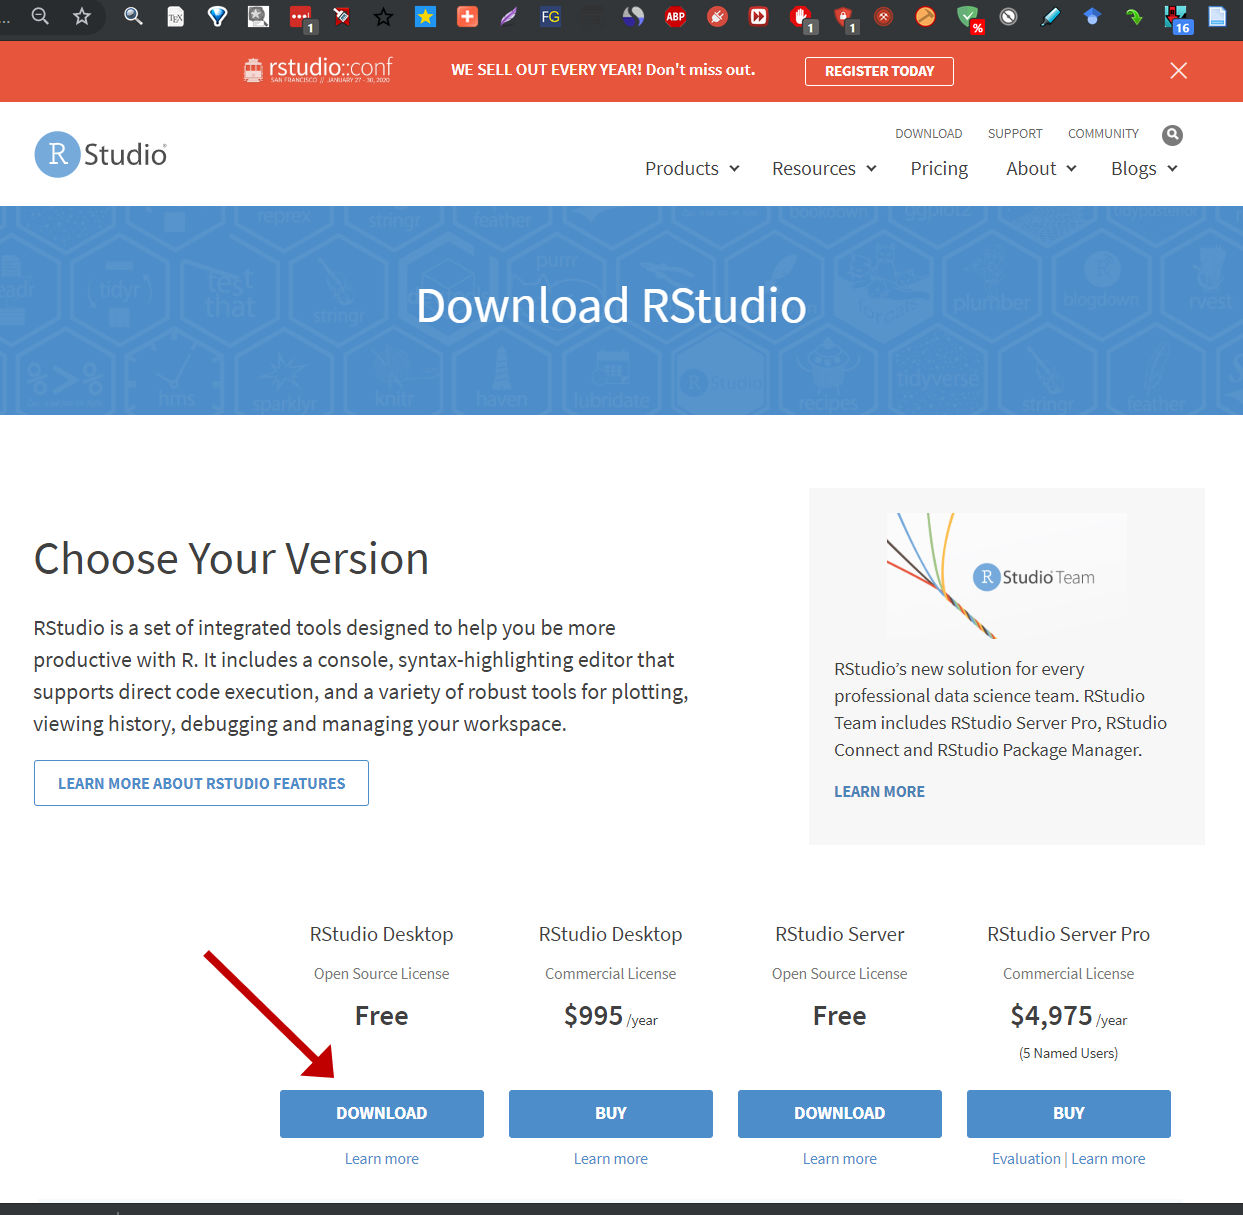
Fig. 9: RStudio download page
Operating in R Studio
If you installed everything correctly, opening R Studio should enable you to use R and write your first commands and scripts. When first opened, R Studio should look like this (except the color, which would be white) or very similar (see image below). Note that, albeit the image below shows only three windows, one is collapsed because no scripting window (or viewer is opened yet).
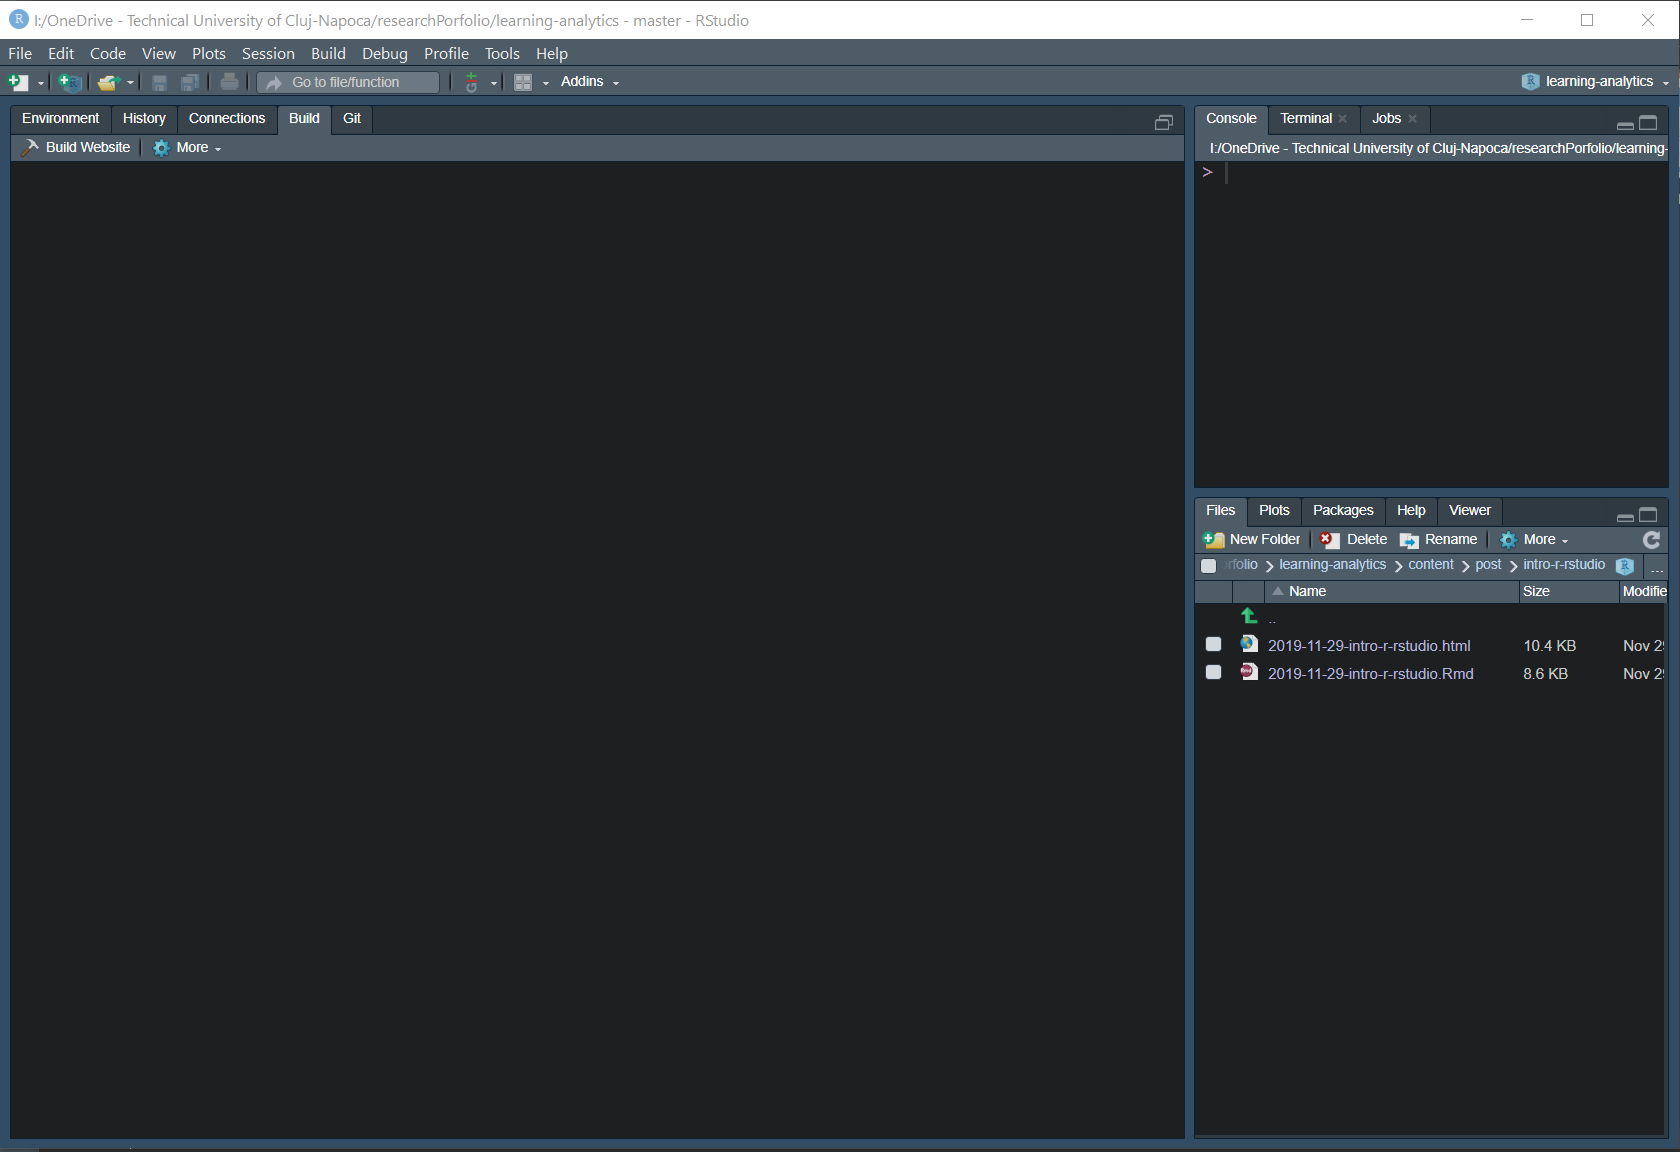
Fig. 10: Starting (empty) R Studio shell
And, while tempting to continue, I’ll detail the necessary operations for our analyses in their separate posts.
Last modified on 2021-04-07